All published articles of this journal are available on ScienceDirect.

Unravelling the Binding Mechanisms of Arenobufagin 30 and Olaparib to Parp-1: Comparative Thermodynamic Insights and Implications for Anticancer Drug Design
Abstract
Introduction
Poly ADP-ribose polymerase 1 (PARP-1) plays a crucial role in the gene repair process and thus attracts significant attention in the development of anti-cancer drugs. Although some FDA-approved compounds, including Olaparib, are effective in BRCA-mutated cancers, they face the obstacle of resistance and adverse reactions. Among these, Arenobufagin, a bufadienolide extracted from Bufo gargarizans, has been shown to be a potential PARP-1 inhibitor. Although the specific process of molecular inhibition is not fully understood, the investigation focused on the binding and molecular interactions between compound 30 and Olaparib to assesstheir potential as a novel PARP-1 inhibitory drug.
Methods
Molecular docking, molecular dynamics (MD) simulations, and molecular mechanics/generalized Born surface area (MM/GBSA) binding free energy (BFE) analyses were employed to explore the interactions between the ligands and the protein. Structural stability and key residues involved in the interactions mediated by the ligands were determined through conformational and per-residue energy decomposition (PRED) analyses.
Results
Arenobufagin 30 showed a binding affinity of –51.88 kcal/mol, which was similar to that of Olaparib (- 52.99 kcal/mol). This affinity was primarily supported by strong electrostatic and van der Waals interactions. Conformational analysis revealed that arenobufagin 30 induced specific dynamic changes in the PARP-1 molecule without disrupting its secondary structures. PRED showed improved binding with the crucial residues of the catalytic domain, suggesting an unusual mode of stabilization and inhibition.
Discussion
The similarity in binding affinity and unique conformational modification presented by arenobufagin 30 indicates an unconventional PARP-1 inhibitory mechanism. The atomistic information provided for the inhibitory actions of naturally occurring bufadienolides can be used to suggest their potential role in counteracting the limitations presented by existingPARP-1 inhibitors.
Conclusion
This study provides mechanistic insight into the inhibition of PARP-1 by Arenobufagin, suggesting it as a candidate for the development of novel anti-PARP-1 agents.
1. INTRODUCTION
Poly(ADP-ribose) polymerase 1 (PARP-1) is a critical component essential for cell integrity, involved in regulating DNA repair, transcription, and cell survival. It is better known for its function in detecting and repairing single-stranded breaks in DNA through the process of facilitating the addition of ADP-ribose residues to proteins, which then act as a scaffold to attract other critical DNA repair proteins [1–3]. Apart from its function in DNA repair, PARP-1 also regulates gene transcription by modulating chromatin structure, interacting with histone proteins, and acting as a transcriptional co-regulator. This process also regulates the expression of critical proteins such as p53 and NF-κB, which are involved in the survival of cancer cells, thus modulating cell fate through apoptosis or stress responses [4, 5]. Apart from its other functions, PARP-1 also regulates various signaling mechanisms involved in cell survival, apoptosis, and inflammation, all of which are linked to cancer development and tumor formation. Due to its multifaceted functions, PARP-1 has also emerged as a potential target for cancer therapy, rendering cancer cells sensitive to genotoxic agents, thereby exploiting their inherent susceptibility [6–8].
PARP-1 inhibitors have proven highly effective in HRR-deficient cancers, including those with BRCA1 or BRCA2 mutations. Since these inhibitors target the concept of synthetic lethality, they can cause the selective death of cancerous cells without affecting normal cells. These inhibitors have been found to be effective in various types of cancers, such as breast cancer, ovarian cancer, pancreatic cancer, and prostate cancer in BRCA mutants. Four FDA-approved PARP inhibitors are clinically relevant. Olaparib (Lynparza®) is used to treat ovarian, breast, pancreatic, and prostate cancers in patients with BRCA mutations. Rucaparib (Rubraca®) is approved for ovarian cancer, especially in those with BRCA mutations who have previously undergone chemotherapy. Niraparib (Zejula®) is used to treat ovarian cancer, regardless of BRCA mutation status, and is also used as maintenance therapy following chemotherapy. Talazoparib (Talzenna®) is approved for the treatment of breast cancer in patients with germline BRCA mutations [9-11].
However, several challenges remain to be overcome. Resistance to PARP inhibitors is common and diminishes their long-term effectiveness in many tumors [12, 13]. Their primary efficacy is limited to patients with BRCA1/2 mutations or other HRR deficiencies, which restricts their use. All four FDA-approved PARP-1 inhibitors are administered orally. Although this is beneficial, the pharmacological potency of these drugs may vary due to differences in pharmacokinetic/pharmaceutical properties, such as variability in oral bioavailability, liver metabolism (particularly CYP-mediated metabolism), drug-drug interactions, and concerns regarding the absorption of the drugs from their formulations. Other concerns may arise from a lack of water solubility or first-pass effects, which may affect dosing. These concerns, along with the mechanisms of resistance and toxic effects, highlight the importance of developing novel structural topographies for PARP-1 inhibitors with enhancedphysicochemical/ pharmacokinetic properties [14, 15]. In addition, although considered safe, the toxic effects of nausea, weakness, and anemia would affect the patients' living standard and may also affect drug compliance. In particular, the potency of these drugs is limited by the lack of BRCA mutations in cancer cells, which necessitates intensive research to identify alternative approaches, possibly through combination therapies or novel strategies. In addition, although these are relatively expensive drugs, they would also constrain access to those who may need them, especially those with reduced health coverage. Dealing with all these concerns through research is vital for maximizing the potency, potential applications, and affordability of PARP drugs for cancer treatment.
Arenobufagin, a naturally present bufadienolide from Bufo gargarizans venom, has been found to be a high-affinity chemo-ligand of PARP-1 via chemical proteomics [16]. This traditional Chinese medicine, known as Arenobufagin, has been of interest due to its pharmacological values, especially its anti-cancer activity [17, 18]. Functional validation has demonstrated a direct binding between Arenobufagin and PARP-1, and its antiproliferative activity decreases significantly when PARP-1 is knocked down in HeLa cells. This suggests that PARP-1 plays a crucial role in mediating the antitumor activity of Arenobufagin. Among the chemical probes of Arenobufagin (arenobufagin 29, 30, and 31), arenobufagin 30 interacted best with PARP-1, as indicated by its greater thermal shift value compared to that of Olaparib. Additional antiproliferative tests revealed that both Arenobufagin and Olaparib were effective in suppressing the growth of the breast cancer cell lines MDA-MB-436 and MCF-7. Interestingly, Arenobufagin was especially adept at mitigating the growth-inhibitory effects of Olaparib [19].
Previous studies have identified the cytotoxic properties of Arenobufagin and its ability to inhibit PARP-1 activity [16, 19, 20]. However, the molecular mechanisms remain incompletely defined. This study attempts to fill this knowledge gap using a suite of molecular modeling approaches, including molecular docking, MD simulations, BFE calculation, PRED, and secondary structure analyses. The results have been compared to those obtained with Olaparib, a clinically approved PARP-1 inhibitor. This integrative approach provides a deep insight into the mechanistic basis of experimentally verified PARP-1 inhibition by Arenobufagin, forming the basis of rational design for the next generation of PARP inhibitors.
2. METHODOLOGY
2.1. System Preparation of Protein and Ligands
The 3D crystallized structure of the human PARP-1 catalytic domain (CAT) in complex with Olaparib (PDB: 7AAD), solved by X-ray diffraction at 2.21 Å resolution, was downloaded from the RCSB Protein Data Bank (https://www.rcsb.org/) [ 21 ]. The crystal structure contains a dimer in the asymmetric unit, but only a single monomer was extracted and used for docking and MD simulations. This selection is supported by structural and functional work indicating that the catalytic activity of PARP-1 is contained within the monomeric CAT, which is fully resolved in the chain selected for this study [22, 23]. The CAT of PARP-1 is responsible for its activity in synthesizing poly(ADP-ribose) (PAR) chains in response to DNA damage. The overall architecture of the CAT contains two distinct subdomains: the helical domain (HD) (662-778 aa) and the ADP-ribosyltransferase (ART) subdomain (789-1011 aa). The HD subdomain serves as a bridge between the ART subdomain and the DNA-binding domains. It facilitates allosteric communication to ensure that the catalytic site is accurately positioned for the activation process. The ART subdomain is responsible for the enzymatic activity of PARP-1, specifically the transfer of ADP-ribose units from NAD+ to target proteins, leading to the synthesis of poly(ADP-ribose) (PAR) chains. Their intercorrelated functions are critical for DNA repair processes [23].
The 3D chemical structures of olaparib (CID: 23725625), rucaparib (CID: 9931954), niraparib (CID:24958200), talazoparib (CID: 135565082), and arenobufagin (CID: 12305198) were retrieved from PubChem using their respective structure-data format (SDF) [24]. As the 3D structures of the arenobufagin analogs were not available, their chemical SMILES were converted into 3D formats using MarvinSketch v23.5 (https://chemaxon.com/marvin) [25]. Before docking, ligand structures were pre-optimized using Avogadro v1.2.0 via steepest descent energy minimization with the GAFF force field to remove steric clashes and relieve torsional strain [26]. Subsequently, Molegro Molecular Viewer v7.0.0 was used to manually inspect and correct chemically relevant features, such as bond angles, formal charges, and hybridization states. This two-step procedure ensured geometrical and chemical consistency of the ligands before docking. Additional energy minimization was done using UCSF Chimera tools and carried out by 100 steepest descent steps with a step size of 0.02 Å, and 10 conjugate gradient steps at a step size of 0.02 Å, using Gasteiger charges with the ANTECHAMBER tool. For the preparation of proteins, “Protein Preparation Wizard” in UCSF Chimera v1.18 was used, which included the removal of water molecules and non-standard residues. All water molecules present within the protein crystal structure were removed to establish a standardized system for solvation simulations using an explicit TIP3P water model. Despite eliminating the water molecules structurally present within the complex to promote hydrogen bonding between Olaparib and the complex, we ensured a balanced simulation process for both ligands (Olaparib and Arenobufagin 30) within the complex. The addition of hydrogen atoms and neutralization were also performed to avoid improper charge distribution [27]. To determine the protonation states at physiological pH, we utilized the H++ server (http://newbiophysics.cs.vt.edu /H++) [28], which corresponds to the AMBER force field methodological procedure [29].
2.2. Molecular Docking Calculations
The molecular docking calculations were performed using the AutoDock Vina v1.1.2 software, which includes the Lamarckian Genetic Algorithm method, within the UCSF Chimera v1.18 software package [ 30 ]. The AutoDock Vina method employs a sophisticated, multithreaded gradient search algorithm to ensure both speed and accuracy [ 31 ]. The calculations were restricted to the active site region to ensure increased accuracy and prevent false positives. The grid parameters surrounding the active site of the human PARP-1 protein were defined using the AutoDock Tools interface with a 5 Å resolution on the x, y, and z planes. The grid coordinates were positioned at (12.2985 x 40.8171 x 9.4696), with grid parameters set at (28.3577 x 25.6445 x 24.8660), ensuring the grid properly encases the active site for ligand interaction. The docking results in the Chimera interface helped visualize the docking pose. Moreover, the docking scores in the Chimera interface analysis are defined by the lowest binding energy values for the most preferred docking pose. The validity of the Vina docking method was established through redocking and overlay analysis, or superimposition of the crystallized form of the ligand onto the native form (Fig. 1). The redocked conformation of Olaparib accurately reproduced the binding conformation of Olaparib found in the crystal structure with a root mean square deviation (RMSD) of 0.439 Å. This indicates that the docking procedure is reliable. A value of 0.439 Å is well within the accepted threshold of < 2.0 Å for successful redocking.

The structural alignment of the redocked ligand (spring green) with that present in the co-crystal structure (dark green) in the active site of PARP-1. The overlaid structure illustrates the accuracy of the binding pose predicted by the docking protocol, which matches the known experimental pose (RMSD = 0.439 Å). The protein is shown in ribbon form (blue) with its surface in semi-transparent mode.
2.3. Molecular Dynamics (MD) Simulation
MD simulations were employed to investigate the structural dynamics and thermodynamic changes of PARP-1 [32]. Simulations were performed using the AMBER 18 Particle Mesh Ewald Molecular Dynamics (PMEMD) module with GPU acceleration (PMEMD.CUDA) [33]. Partial charges were assigned via the ANTECHAMBER protocol to prepare the ligands utilizing the restrained electrostatic potential (RESP) and the General Amber Force Field (GAFF). The LEAP module was used for system solvation and neutralization by adding hydrogen atoms and sodium and chloride ions. A TIP3P water box with 12 Å padding was used to fully solvate the systems. Previously, the pdb4amber command modified the topologies of the protein systems. Two stages of minimization were conducted: partial minimization with a 500 kcal/mol restraint for 2500 steps and full minimization without restraints for 200 steps. Subsequently, the systems were heated from 0 to 300 K over 50 ps in the NVT ensemble, using a Langevin thermostat and harmonic potential restraints of 10 kcal/mol Å. Equilibration was achieved using the SHAKE algorithm to constrain hydrogen bonds by applying a pressure of 1 bar with a Barendsen-Barostat to simulate standard physiological conditions. For each system, MD simulations were run for 200 ns with a 2-fs time step in the isothermal-isobaric (NPT) ensemble at 300 K, maintaining a constant pressure of 1 bar using a Langevin thermostat [34, 35]. After the simulation, the key structural dynamics were analyzed using RMSD, root mean square fluctuation (RMSF), radius of gyration (ROG), solvent-accessible surface area (SASA), dynamic cross-correlation matrix (DCCM), principal component analysis (PCA), and dictionary of protein secondary structure (DSSP). The post-simulation analyses were performed using the respective modules of the AMBER 18 software package, namely, CPTRAJ & PTRAJ [36]. Visualization analyses were performed using the VMD software tools. In addition to this, UCSF Chimera & Discovery Studio Client 2024 were also used for the analyses. Furthermore, the statistical analysis was performed using the Origin software package [37].
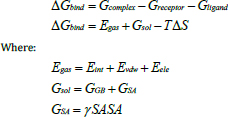
GB calculations approximate the polar solvation free energy, taking into account the Born radii of atoms and pairwise electrostatic interactions. On the other hand, SA calculations evaluate hydrophobic interactions, which are reduced upon binding, expressed in terms of buried surface area (BSA) created during protein-ligand complex formation. The nonpolar solvation energy was modeled using SA of protein-ligand interface, a water probe radius of 1.4 Å, and a Surface Tension Constant (γ) value of 0.0072 kcal/molÅ^2. Due to the high computational requirements, calculations of BFE were performed using 50,000 frames from an MD run of 200 ns [ 34 ]. This extensive frame set has enabled the adequate sampling of the conformational space of the complex, yielding more reliable and accurate results regarding the binding free energy. The complete energy decomposition analysis performed using the MM/GBSA method, which involves the energy terms from both molecular mechanics calculations and solvation energy terms, provides important insights into the energy of PARP-1 binding. The equation for the calculation of BFE (∆G) is the following:
2.4. Receptor – Ligand Interaction Analysis
To understand the binding modes and roles of non-covalent molecular interaction forces in the interaction between the human PARP-1 protein target and its ligands, the system utilized Biovia Discovery Studio Visualizer software [ 38 ].
2.5. Binding Free Energy (BFE) Computations
A molecular mechanics/generalized Born surface area (MM/GBSA) method was employed to calculate the binding free energy (BFE) between PARP-1 and its ligands [39, 40]. This method has been widely used in structure-based drug design and molecular modeling to provide a more specific, integrated analysis of binding affinities than scoring functions applied in docking calculations. The MM/GBSA method combines molecular mechanics calculations, which treat van der Waals, electrostatic, and internal energy components, with a generalized Born (GB) method dealing with polar solvation in a dielectric continuum model. Furthermore, it includes Surface Area (SA) calculations to evaluate nonpolar solvation energy.
Here, ΔG bind is the gas phase summation energy, Egas is the gas phase energy, Gsol is the free solvation energy, T ΔS is the total interaction entropy, Eint is internal energy, Eele is coulomb energy, and Evdw is van der Waals energy. The Egas energy was evaluated using the AMBER force-field FF14SB, while Gsol was evaluated based on both the energy for polar and nonpolar structures.
2.6. Per-residue Energy Decomposition (PRED) Analysis
PRED analysis using the MM/GBSA method in the AMBER 18 software was employed to evaluate the contribution of each residue to the binding free energy of the PARP-1/ligand complexes [ 41 ].
3. RESULTS AND DISCUSSION
3.1. Binding Affinity and Protein-Ligand Interaction Networks
The docking scores reflect the relative advantage of arenobufagin derivatives over conventional PARP-1 inhibitors (Table 1). Notably, arenobufagin 31 had a docking score of -10.9 kcal/mol, which ranked higher than that of rucaparib (-10.3 kcal/mol) and niraparib (-9.9 kcal/mol), signifying its high binding strength. However, Olaparib had the highest score of -12.2 kcal/mol, and arenobufagin 30 ranked next with a score of -11.7 kcal/mol, which ranked higher than that of talazoparib (-11.1 kcal/mol), thus establishing its high inhibitory capacity. It is evident that arenobufagin derivatives, particularly arenobufagin 30 and 31, exhibit binding strength comparable to that of PARP-1 inhibitors, thereby necessitating further investigation. Furthermore, the protein-ligand interaction study demonstrates the flexibility of both PARP inhibitors and arenobufagin derivatives in employing a set of specific interactions to achieve the highest binding strength (Fig. 2). Among them, Olaparib showed a very well-structured binding with robust hydrogen bonding with residues His862, Gly863, ARG878, and Tyr897, a special fluorene halogen bonding with Gly894, along with π-π stacking interactions with Tyr896, Tyr907, which form a well-established pharmacophore motif to capture the robust inhibitor binding within the ART subdomain [9, 10].
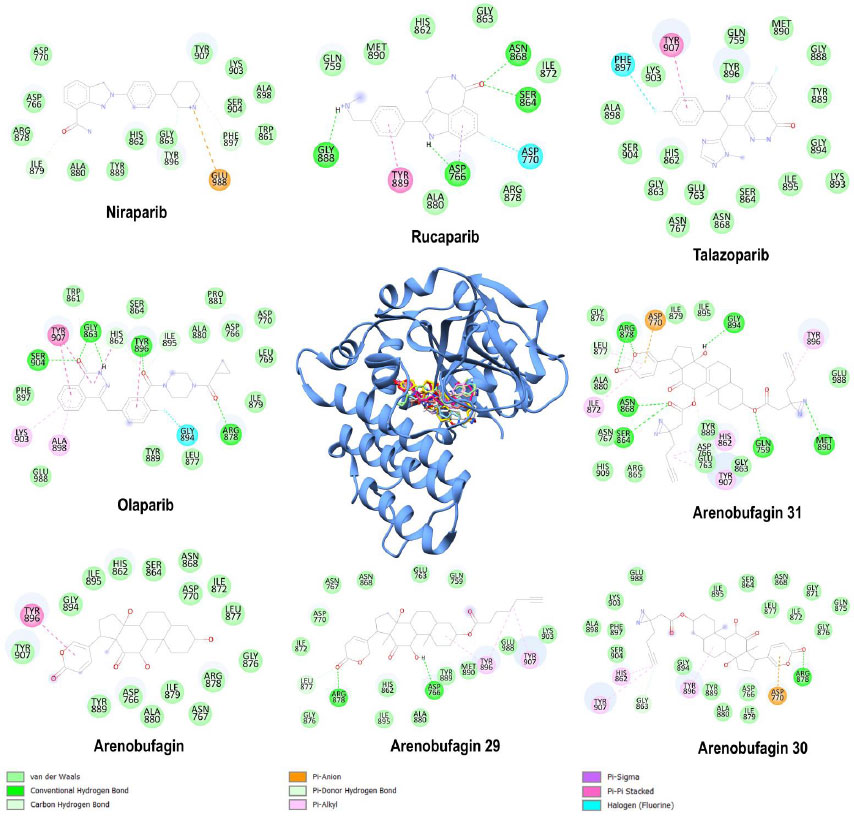
Docking pose of olaparib (spring green), rucaparib (sky blue), niraparib (tan), talazoparib (pink), arenobufagin (salmon), arenobufagin 29 (gray), arenobufagin 30 (magenta), and arenobufagin 31 (yellow) in the catalytic binding site of human PARP-1 (cornflower blue) with their respective two-dimensional (2D) protein-ligand interaction frameworks. Bond types have been indicated.
| Ligand | Docking Score (kcal/mol) | Hydrogen Bonds | Hydrophobic Interactions |
|---|---|---|---|
| Olaparib | -12.2 | His862, Gly863, Arg878, Tyr897, Ile895, Ser904 | His862, Tyr896, Ala898, Lys903, Tyr907 |
| Rucaparib | -10.3 | Asp766, Ser864, Asn868, Gly888 | Asp766, Tyr889 |
| Niraparib | -9.9 | Ile879, Tyr896, Phe897 | - |
| Talazoparib | -11.1 | - | Tyr907 |
| Arenobufagin | -11.0 | - | Tyr896 |
| Arenobufagin 29 | -10.5 | Asp766, Leu877, Arg878 | Tyr896, Tyr907 |
| Arenobufagin 30 | -11.7 | Gly863, Arg878 | His862, Tyr896, Tyr907 |
| Arenobufagin 31 | -10.9 | Gln759, Asp766, Ser864, Asn868, Leu877, Arg878, Gly894, Met890 |
His862, Ile872, Leu877, Tyr896, Tyr907 |
Rucaparib relies on reduced van der Waals interactions, featuring aromatic π–sigma and π–π stacking with Tyr889 and Asp770, as well as a fluorine halogen bond. Niraparib utilizes electrostatic interactions with Glu988, carbon–hydrogen bonds, and strong van der Waals forces. In contrast, talazoparib primarily depends on extensive van der Waals interactions, a π–π stacking bond with Tyr907, and a fluorine halogen interaction with Phe897. Arenobufagin primarily participated in van der Waals-dominated interactions, including one significant π–π stacking interaction with Tyr896.
Arenobufagin primarily participated in van der Waals-dominated interactions, including one significant π–π stacking interaction with Tyr896. The arenobufagin derivatives 29-31 increasingly developed the complexity of these interactions. Arenobufagin 29 has established hydrogen bonds and π-alkyl interactions. Arenobufagin 31 exhibited a network of hydrogen bonds, van der Waals interactions, and a π-anion charge interaction and shared the balanced binding features of Olaparib. Of note, residues Tyr896, Tyr907, and Asp770 were uniformly used as contact points for the top-scoring ligands, emphasizing their role as structural anchors for ligand binding [ 23 ]. The interaction of arenobufagin 30 with Asp770, facilitated by a π-anion contact and conserved hydrogen bonding patterns, further supports its stabilization within the PARP-1 catalytic cleft, similar to that of Olaparib. These findings are in agreement with the thermodynamic and structural data presented in the following sections and provide a molecular rationale for the inhibitory potential of arenobufagin 30.
3.2. Characterization of the Conformational Dynamics of PARP-1
The probing of dynamic changes of a biological target is an essential basis for describing its physiological function, generally as influenced by its binding effector. In the case of the PARP-1 protein, we aimed to assess the degree of structural stability, rigidity, flexibility, solvent-like behavior, and folding behavior by calculating alpha carbon RMSD, RMSF, RoG, SASA, and intra-molecular hydrogen bond analyses in the presence of Arenobufagin 30 and Olaparib [38, 42]. For each analysis, comparisons were made with unbound PARP-1 (Apo).
The mean RMSD values indicate that all three systems (Arenobufagin 30–PARP-1, Olaparib–PARP-1, and Apo) reached equilibrium, with Olaparib conferring greater structural stability than Arenobufagin 30. There was a visible sharp rise in backbone deviations around the 100–200 ns region for the Arenobufagin 30 complex, indicating ligand-induced flexibility to various degrees (Fig. 3A). Such destabilization may result from ligand-induced conformational plasticity within the HD and ART domains, thereby disrupting the functional architecture of PARP-1. Such dynamic destabilization may represent an alternative inhibitory mechanism, in which enzyme function is modulated through competitive binding and by perturbing its structural integrity and flexibility. The mean RoG of Arenobufagin 30–PARP-1, Olaparib–PARP-1, and Apo was 21.09 Å, 20.78 Å, and 20.95 Å, respectively. Our results highlight comparable degrees of rigidity between unbound PARP-1 and bound PARP-1 (Fig. 3B). However, Olaparib confers a more rigid conformation, while Arenobufagin 30 confers a looser conformation. The RoG of PARP-1 rose above 21.2 from 100-200ns when bound to Arenobufagin 30, as was observed for the sharp rise in RMSD around the same time frame. Furthermore, the mean RMSF of Arenobufagin 30–PARP-1, Olaparib–PARP-1, and Apo was found to be 1.10 Å, 0.83 Å, and 0.80 Å, respectively. Our results indicate that Arenobufagin 30 significantly increases the residue flexibility of PARP-1 compared to Olaparib because it induces the highest binding potential in these residues. In fact, the degree of residue displacement was highest for both the HD and ART subdomains in Arenobufagin 30 binding compared to Olaparib binding (Fig. 3C). The mean SASA of Arenobufagin 30–PARP-1, Olaparib–PARP-1, and Apo was found to be 16197.64 Å2, 15496.10 Å2, and 15907.71 Å2, respectively. The SASA technique measures the extent to which a protein’s surface, particularly its hydrophobic residues, is exposed to the solvent. It helps assess protein folding/unfolding by tracking changes in solvent exposure. Hydrophobic residues are buried within folded proteins, while they become exposed during unfolding. SASA is also useful for understanding protein- inhibitor interactions, as binding can alter the surface exposure of proteins. A decrease in SASA values upon inhibitor binding generally represents stability, while an increase may indicate either destabilization or unfolding.
From the SASA values obtained in the simulation studies, it was possible to interpret that Olaparib increases the folding stability of PARP-1, whereas the unfolding of PARP-1 is promoted by Arenobufagin 30. It was evident from the RMSD and RoG plots that there was an appreciable rise in the SASA values for the interaction of PARP-1 with the compound Arenobufagin 30 in the simulation period of 100ns to 200ns (Fig. 3D). Moreover, calculations of intramolecular hydrogen bonding (H-bonding) were performed to elucidate the overall stability of PARP-1 during the 200-ns simulation period. It was evident that the intramolecular hbs play a significant role in the structural integrity of the protein. These bonds offer valuable insights into the impact of these ligands on the stability and folding of PARP-1. In the plot of intramolecular hbs for PARP-1 with the mentioned compounds (Arenobufagin 30, Olaparib), the average values for the mentioned complexes were found to be 160.46, 166.71, and 167 (Fig. 3E). The highest HB counts of Olaparib–PARP-1 and Apo suggest greater stability, whereas there are fewer hydrogen bonds in Arenobufagin 30–PARP-1, indicating the potential for destabilization or a shift in conformation. These results thus place Olaparib on top with respect to the stability induced in PARP-1 over Arenobufagin 30, but not by a significant margin.
3.3. Principal Component Analysis (PCA)
Principal component analysis (PCA) was employed to examine the conformational dynamics of PARP-1 by analyzing the displacement of alpha carbon atoms throughout the entire simulation [ 43 ].
The first two principal components (PC1 and PC2), which describe the main motion patterns along the first and second eigenvectors (ev1 and ev2), were obtained from the decomposition of the covariance matrix. Using PCA, we identified the major conformational changes and the collective atomic motions of PARP-1 during the 200 ns simulations and provided a general overview of flexibility and structural dynamics in complex with each ligand. According to the PCA results, the MD snapshot trajectories from all systems formed a compact cluster (Fig. 4A), indicating that these systems reached their stable conformation within the simulation time. Besides, atomic movements along PC1 vs PC2 were bidirectional, indicating that the movements in these systems are correlated. More importantly, the dispersion of residues of PARP-1 is higher in the presence of arenobufagin 30 compared to Olaparib (Fig. 4A-C). The increased residue dispersion in the Arenobufagin 30 complex suggests a higher degree of conformational flexibility compared to Olaparib, which aligns with its higher RMSF and SASA scores. It is inferred that the pattern of PARP-1 dynamic changes induced by Arenobufagin 30 may differ from that of other compounds and could affect its CAT mobility. In fact, a look at the conformations of PARP-1 at 1 ns, 100 ns, and 200 ns trajectory snapshots confirms the preserved architectural variability in the presence of Olaparib compared to arenobufagin 30, albeit not significantly (Fig. 4D-F).
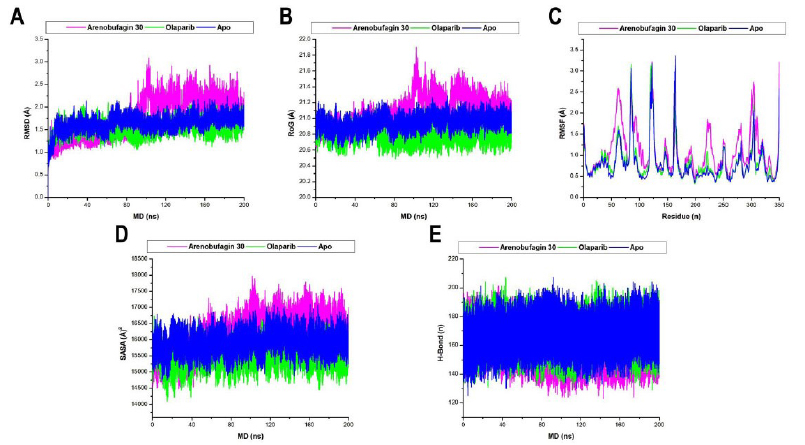
Graphical representation of the alpha carbon (A) RMSD, (B) RoG, (C) RMSF, (D) SASA, and (E) Hb of Arenobufagin 30–PARP-1 (magenta), Olaparib–PARP-1 (green), and Apo (blue). Computations were performed over a 200 ns MD simulation period.
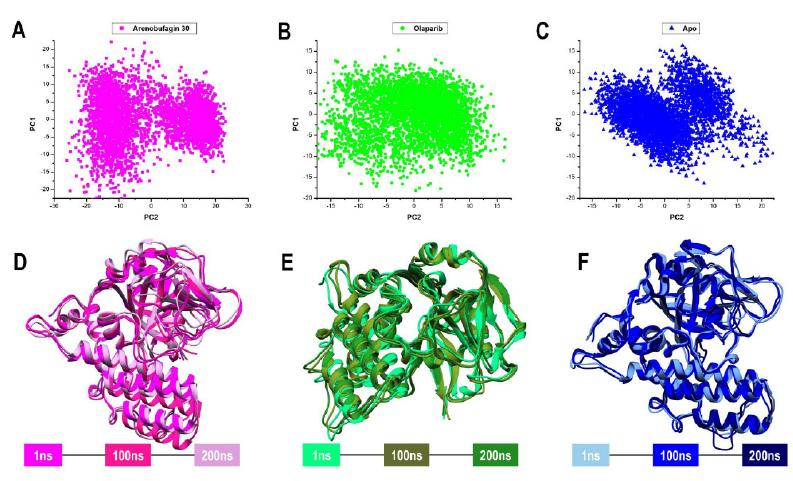
(A–C) PCA scatter plots representing dominant motion along PC1 and PC2 during 200 ns MD simulations of PARP-1 in complex with (A) Arenobufagin 30 (magenta), (B) Olaparib (green), and (C) Apo (blue). Each point represents a conformational state sampled along the trajectory. (D–F) Structural overlays of PARP-1 snapshots at 1 ns, 100 ns, and 200 ns for the (D) Arenobufagin 30, (E) Olaparib, and (F) Apo systems. Structures are shown in different orientations to highlight local conformational changes in each system, including shifts in loop and secondary structure regions relevant to ligand interaction and domain mobility. These views complement the PCA data and emphasize time-resolved dynamic changes.
3.4. Dynamic Cross-Correlation Matrix (DCCM)
The DCCM calculation was employed to investigate the interaction of amino acids in PARP-1 during the MD simulation period [34, 35]. By analyzing alpha carbon motions, DCCM demonstrated how different parts of the protein were correlated (moved together) or anticorrelated (moved inversely), which helped interpret how well the protein-inhibitor complex was functioning. The scale bar in the figure depicts highly positively correlated, negatively correlated, and uncorrelated areas using +1, -1, and 0, respectively (Fig. 5). The results from the DCCM computation revealed that different parts of PARP-1 were correlated in their motions when inhibited by different compounds, although to varying extents. The unbound form of PARP-1 showed the strongest correlation with motions, while Olaparib and Arenobufagin 30 were moderately to weakly correlated. More importantly, none of the protein-inhibitor complexes were found to have anticorrelated motions in their constituents, suggesting that none of these proteins were moving in a way that would negatively affect their structural integrity. This absence of destabilizing motions, along with the observed coordination, suggests that PARP-1 retains its structural integrity and rigidity, even when bound to inhibitors.
3.5. BFE Analysis
The MM/GBSA approach was used in calculating the BFEs between arenobufagin 30 and Olaparib with PARP-1 for 50,000 MD snapshot frames [34]. Further energy components could be calculated by this method; hence, it was possible to understand the contribution of each component to the overall binding affinity. The following energy terms were computed: electrostatic energy (∆Eelec), van der Waals energy (∆EvdW), polar solvation energy (∆GGB), nonpolar solvation energy (∆GSA), gas-phase energy (∆Ggas), total solvation energy (∆Gsolv), and total binding free energy (∆Gbind) (Table 2). For Arenobufagin 30–PARP-1, the binding analysis showed more favourable ∆Eelec (-80.30 kcal/mol) and ∆EvdW (-72.55 kcal/mol) interactions compared to Olaparib–PARP-1 (∆Eelec = -44.71 kcal/mol and ∆EvdW = -57.00 kcal/mol). However, the value of ∆GGB for arenobufagin 30 was higher (109.32 kcal/mol) than that of Olaparib (55.27 kcal/mol), resulting in a higher value of ∆Gsolv for arenobufagin 30. However, the total BFEs (∆Gbind) for both complexes were similar: -51.88 kcal/mol for arenobufagin 30 and -52.99 kcal/mol for Olaparib. This indicates that both agents have similar binding affinities. The calculations depicted above give a clear insight into the nature of molecular interactions involved in the binding of
both arenobufagin 30 and Olaparib to PARP-1. The role of ∆Eelec, as well as the van der Waals (vdW) forces, in stabilizing the two complexes is well elucidated. Examination of the molecular complexes at 1 ns, 50 ns, 100 ns, and 200 ns reveals that there was no change in the binding landscape; both agents remained firmly bound to the active site of PARP-1 throughout the entire simulation duration (Fig. 6). Moreover, arenobufagin 30 was found to be strongly bound to the PARP-1 catalytic residue, compared to Olaparib. This was evident from the lesser degree of displacement of arenobufagin 30 compared to the latter. Conversely, at a time period of 50 ns and 100 ns, there were slight changes and rotational freedom for Olaparib. This can show changes in the binding interactions and the energy landscape between the two ligands. Although it remains effective, there appears to be a dynamic characteristic associated with Olaparib. This suggests that arenobufagin 30 may utilize other attractive interactions, making it a promising lead for the targeted therapy of PARP-1. Taken together, the results indicate a promising alternative in arenobufagin 30, not to mention its ability to form stronger non-covalent bonds. As indicated by experimental studies, the results are highly significant for validating arenobufagin 30 as a competitive inhibitor for PARP-1 [16, 17].
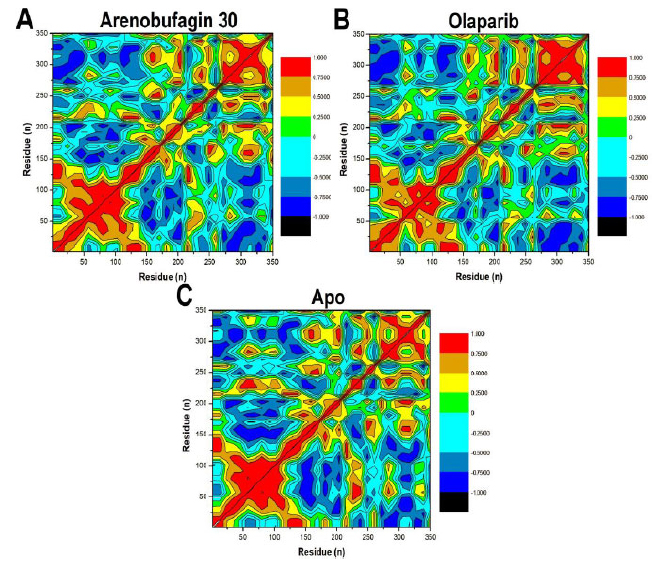
Graphical depiction of α carbon residue correlated/anticorrelated motion calculated by DCCM analysis for: (A) Arenobufagin 30–PARP-1, (B) Olaparib–PARP-1, and (C) Apo. The DCCMs indicate residue-residue correlated motion patterns, where red shows highly correlated motions, black shows anticorrelated residues, and other shades indicate residues which lie in.
| Complex | BFE Terms (kcal/mol) | ||||||
|---|---|---|---|---|---|---|---|
| ∆EvdW | ∆Eelec | ∆GGB | ∆GSA | ∆Ggas | ∆Gsolv | ∆Gbind | |
| Arenobufagin 30–PARP-1 | -72.55 ± 0.11 |
-80.30 ± 0.37 |
109.32 ± 0.31 |
-8.35 ± 0.01 |
-152.85 ± 0.36 |
100.98 ± 0.31 |
-51.88 ± 0.13 |
| Olaparib–PARP-1 | -57.00 ± 0.10 |
-44.71 ± 0.16 |
55.27 ± 0.12 |
-6.56 ± 0.01 |
-101.71 ± 0.15 |
48.71 ± 0.12 |
-52.99 ± 0.11 |
Note:∆Eelec (electrostatic energy), ∆EvdW (van der Waals energy), ∆GGB (polar solvation energy), ∆GSA (non-polar solvation energy), ∆Ggas (gas-phase energy), ∆Gsolv (Total solvation free energy of polar and non-polar states), and ∆Gbind (total binding free energy).
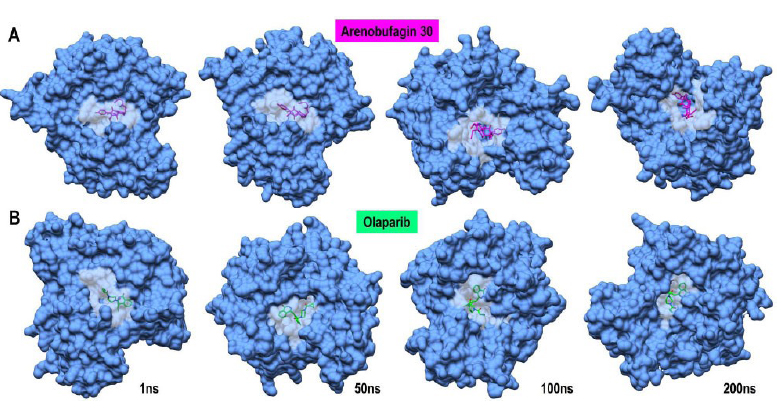
Representative MD snapshots showing the binding pose stability of (A) Arenobufagin 30 (magenta) and (B) Olaparib (spring green) within the PARP-1 active site over the 200 ns simulation period. Structural frames are shown at 1 ns, 50 ns, 100 ns, and 200 ns. Both ligands remained stably bound in the catalytic pocket with no significant displacement. The protein is shown as a blue surface, with the ligand-binding pocket rendered in grey to emphasize site occupancy.
3.6. PRED Analysis
The electrostatic and van der Waals contributions of the active-site residues in the binding of inhibitors to PARP-1 were evaluated using PRED analysis based on BFE computed across 50000 stabilized MD trajectory frames using the MM/GBSA protocol [41]. This study explored the particular energetic contributions of residues to binding. For arenobufagin 30, Glu327 and Asp109 were found to make significant contributions to binding energy, providing the highest electrostatic binding components of -139.772 kcal/mol and -137.374 kcal/mol, respectively. High van der Waals binding components were also detected, particularly with Trp200 and Tyr228 of -20.809 kcal/mol and -13.599 kcal/mol, respectively. The cumulative effect of these electrostatic binding components, together with those of van der Waals binding, was responsible for strongly binding arebufagin 30 to protein hot spots, particularly those with residues Glu327 of -148.889 kcal/mol and Asp109 of -147.771 kcal/mol (Fig. 7A). On the other hand, Olaparib binds to crucially similar sites, particularly those of Glu327, which has an ∆Elec of -126.91 kcal/mol, as well as Asp109, with an ∆Elec of -127.634 kcal/mol. The binding energy contributed by Olaparib to bind to these spots is slightly less intense than that of arebufagin 30, suggesting less ideal binding. Its binding energy contributed to a slightly less perfect binding to Trp200 of -20.249 kcal/mol and to Tyr228 of -13.231 kcal/mol. Its binding energy contributed was generally lower (Fig. 7B). This indicates that, although both compounds bind to specific residues, the interaction strength with those residues is stronger for arenobufagin 30, resulting in a more stable binding conformation. Notably, the interaction with Arg217 reveals a significant difference between the two inhibitors. In arenobufagin 30, Arg217 contributes a minor electrostatic component of 64.716 kcal/mol, indicating that arenobufagin 30 exhibits a repulsive interaction not observed with Olaparib. In Olaparib, Arg217 contributes to a smaller electrostatic component value of 31.309 kcal/mol. The difference between the two values might show that arenobufagin 30 has a less significant stabilizing component at that specific residue, which can potentially influence the binding dynamics between arenobufagin 30 and its target. The PRED analysis implies that electrostatics, as well as van der Waals interactions with significant residues such as Glu327, Asp109, and Trp200, play a very significant role for both Arenobufagin 30 and Olaparib. Although variations are observed at specific points, the binding affinity for both inhibitors is generally equivalent; arenobufagin 30 exhibits slightly stronger interactions at the residue level. These results suggest that arenobufagin 30 could be a viable alternative to Olaparib, potentially with even more favorable interactions in some areas of the PARP-1 active site, and, as such, is worthy of further investigation as a drug candidate.
3.7. Dictionary of Secondary Structure of Protein (DSSP) Analysis
The impact of Arenobufagin 30 and Olaparib on the secondary structure of PARP-1 was observed over a 200 ns MD simulation to assess the ligands' stabilizing effect. Each residue was assigned an integer using the DSSP method: 0-7, to define its major secondary structure: None, Parallel (β), Antiparallel (β), 3-10, Alpha, Pi, Turn, and Bend, as shown in Fig. (8). Classifications are based on predicted atomic coordinates and hydrogen bond interactions. Transitions to turn, bend, and “None” states are usually indicative of loss of hydrogen bonds, whereas transitions into beta sheets, alpha helices, and 3-10 helices indicate structural retention [34, 44]. Clear variations in secondary structure stability were detected in all systems. The Arenobufagin 30–PARP-1 system exhibited robust structural maintenance, with the alpha helices and beta sheets well retained throughout the simulation. Transitions to turn and bend states were occasionally observed, particularly for residues 180–200, indicating local flexibility. In the Olaparib–PARP-1 system, secondary structure transitions were more frequent, with residues 150–200 shifting from alpha helices to bends and turns, indicating a moderate destabilizing effect. Maximum perturbation was observed in the Apo system, with a significant rise in “None” states in the N-terminal (residues 50–100) and mid-range regions (150–200), reflecting a substantial loss of secondary structure stability due to the absence of ligand binding. Both Arenobufagin 30 and Olaparib maintained the secondary structure of PARP-1 better than the Apo system, with Arenobufagin 30 showing the most significant preservation effect. This maintenance is important because it implies a correlation with inhibitory efficacy, thus highlighting Arenobufagin 30 as an effective stabilizer of PARP-1 architecture for therapeutic purposes. Furthermore, the destabilization observed in the Apo system underscores the importance of ligand interactions in maintaining protein integrity.
This study's findings are largely consistent with existing information on PARP-1 inhibitors. For example, the binding affinity of Arenobufagin to PARP-1, as observed experimentally, was confirmed in this research, and additional insights into atomic-level interactions were contributed to the current understanding of inhibitors [ 16 ]. Based on the protein structure dynamics demonstrated to take place in the work of Ogden et al. [ 23 ], the RMSD, hydrogen bonding, and electrostatic interactions contributed equally, showing that Olaparib stabilizes the catalytic domain more compared to Arenobufagin 30, despite the ability of the two inhibitors to reach a BFE that is equal to that of the others [ 23 ]. The role of electrostatic interactions, for example, was important in this work; yet, it was identified as forming hotspots for interactions within the PARP-1-ligand complex [ 10 ]. This implies that the existing structure simulations used in the work are validated to accurately reproduce existing interactions, thereby improving the existing work.
In addition, because Arenobufagin 30 represents a new chemotype targeting PARP-1, future studies may benefit from a higher-resolution examination along the trajectory to investigate hydrogen bond dwell times, conformational ensemble analyses, or domain-related correlation patterns. These data will help to supplement the global profiles derived in this study, contributing to the development of new drugs based on Arenobufagin.
3.8. Future Directions
In addition to the cited binding affinities, the particular electrostatic and van der Waals interaction fingerprints of arenobufagin 30 could also be of great translational value.
Resistance to clinically used PARP inhibitors may arise via BRCA1/2 mutation reversion, PARP1 point mutations resulting in decreased affinity, and replication fork stabilization [7, 13, 45].
The distinct interaction fingerprint of arenobufagin 30 relative to Olaparib could present a different inhibition strategy, being more resilient to these modifications, thus offering a potential remedy against the acquired resistance. Although displaying great anti-cancer efficacy, the pharmacological weaknesses of buadienolides, including Arenobufagin, are well documented. Arenobufagin has been reported to induce cardiac toxicity via Na+/K+ ATPase inhibition [ 46 ], and buadienolides in general display small oral bioavailabilities and therapeutic indexes [ 47 ]. These issues highlight the importance of optimizing structure and formulation efforts to enhance the pharmacological and safe use of these compounds.
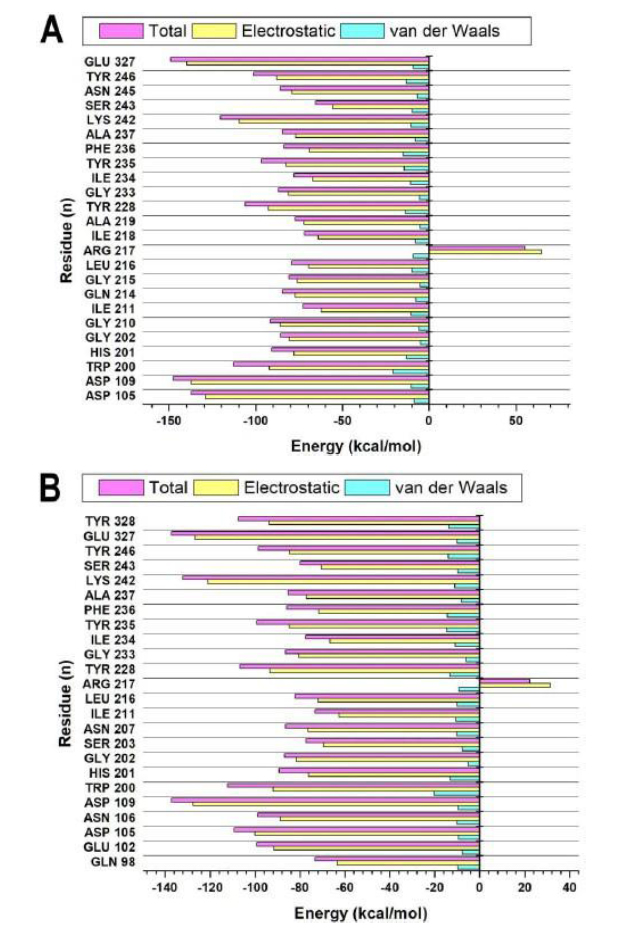
The PRED analysis of the active site residues of PARP-1 is visually depicted for (A) arenobufagin 30 and (B) olaparib, based on computations from 50,000 MD trajectory frames.
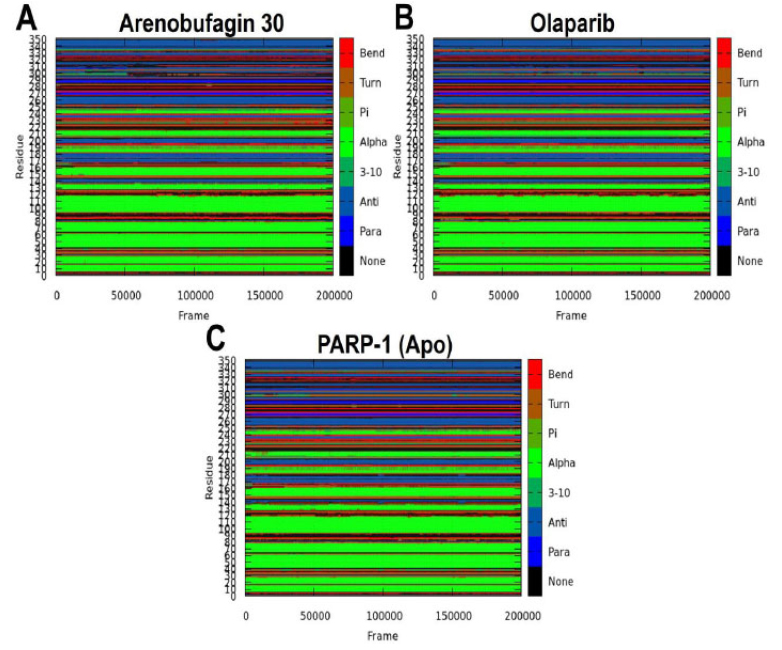
Illustrations showing the dynamical nature of the secondary structures of (A) Arenobufagin 30-PARP-1, (B) Olaparib-PARP-1, and (C) Apo during a 200 ns MD simulation run. The color panels showing the different secondary structures (such as Bend, Turn, Pi-helix, Alpha-helix, 3-10 helix, Antiparallel beta-sheet, Parallel
These results provide a mechanistic explanation for the potential evaluation of arenobufagin 30 as a novel scaffold for PARP1 with a unique interaction profile. However, future research should focus on enhancing the translational implications of this strategy through biochemical binding assays, cellular validation studies in both BRCA-deficient and BRCA-wild-type tumors, and thorough ADME/Tox characterization. This work is crucial for assessing whether arenobufagin 30 might serve as a prospective lead for the future development of novel PARP1 inhibitors. In conclusion, the results described in this study regarding the anticipated conformational changes and energy contributions can be regarded as hypotheses that require verification.
CONCLUSION
In this investigation, the molecular mechanisms of arenobufagin 30, an experimentally verified derivative, were examined for its inhibition of PARP-1, with the results compared to those of the legally approved drug olaparib. The docking scores and binding free energy values of arenobufagin 30 were comparable to those of Olaparib, indicating high affinity towards PARP-1. The analyses of the structures and dynamics revealed that arenobufagin 30 induces novel transformations in PARP-1, which increase its flexibility while maintaining its secondary structures, resembling those of Olaparib. Notably, arenobufagin 30 possessed the best binding site occupancy, indicating its promise as an effective drug candidate. Principal component analysis, combined with dynamic cross-correlation, facilitated an understanding of the beneficial transformations and collective motions triggered by arenobufagin 30, which enable it to exert its stabilizing effect on PARP-1.
These computational results align with experimental findings regarding the inhibitory activity of Arenobufagin against PARP-1. For instance, Bhukta et al. (2021) investigated the significant PARP-inhibiting ability of Arenobufagin in cells, while another study by Ma et al. (2019) demonstrated that Arenobufagin can induce apoptosis in cancer cells through a PARP-mediated mechanism. This work enhances our understanding of the molecular mechanism underlying the inhibitory activity of arenobufagin 30 against PARP-1, and the results may provide new insights for the development of next-generation anti-cancer drugs based on the distinct binding capabilities offered by arenobufagin derivatives.
AUTHORS’ CONTRIBUTIONS
The authors affirm their participation in the work as follows: K.K.: Conception and design of the work, Data collection, Analysis, and interpretation of the results; V.M.: Preparation of the manuscript. All authors reviewed the results, contributed to the discussion, and approved the final version of the manuscript.
LIST OF ABBREVIATIONS
| PARP-1 | = Poly (ADP-ribose) Polymerase-1 |
| DNA | = Deoxyribonucleic Acid |
| HRR | = Homologous Recombination |
| ΔG | = Binding Free Energy |
| IC50 | = Half-Maximal Inhibitory Concentration |
| FDA | = Food and Drug Administration |
| RMSD | = Root Mean Square Deviation RMSF = Root Mean Square Fluctuation |
| NAD+ | = Nicotinamide Adenine Dinucleotide (oxidized form) |
| MD | = Molecular Dynamics Kcal/mol = Kilocalories per mole 3D = Three-Dimensional |
AVAILABILITY OF DATA AND MATERIALS
All data generated or analyzed during this study are included in this published article.
ACKNOWLEDGEMENTS
The authors thank the Durban University of Technology, South Africa for its support. They also thank the South African Center for High-Performance Computing (CHPC) (https://www.chpc.ac.za/) for their technical assistance.